Technical Analysis vs Fundamental Analysis
Technical analysis, fundamental analysis. What's the difference and why are they important?
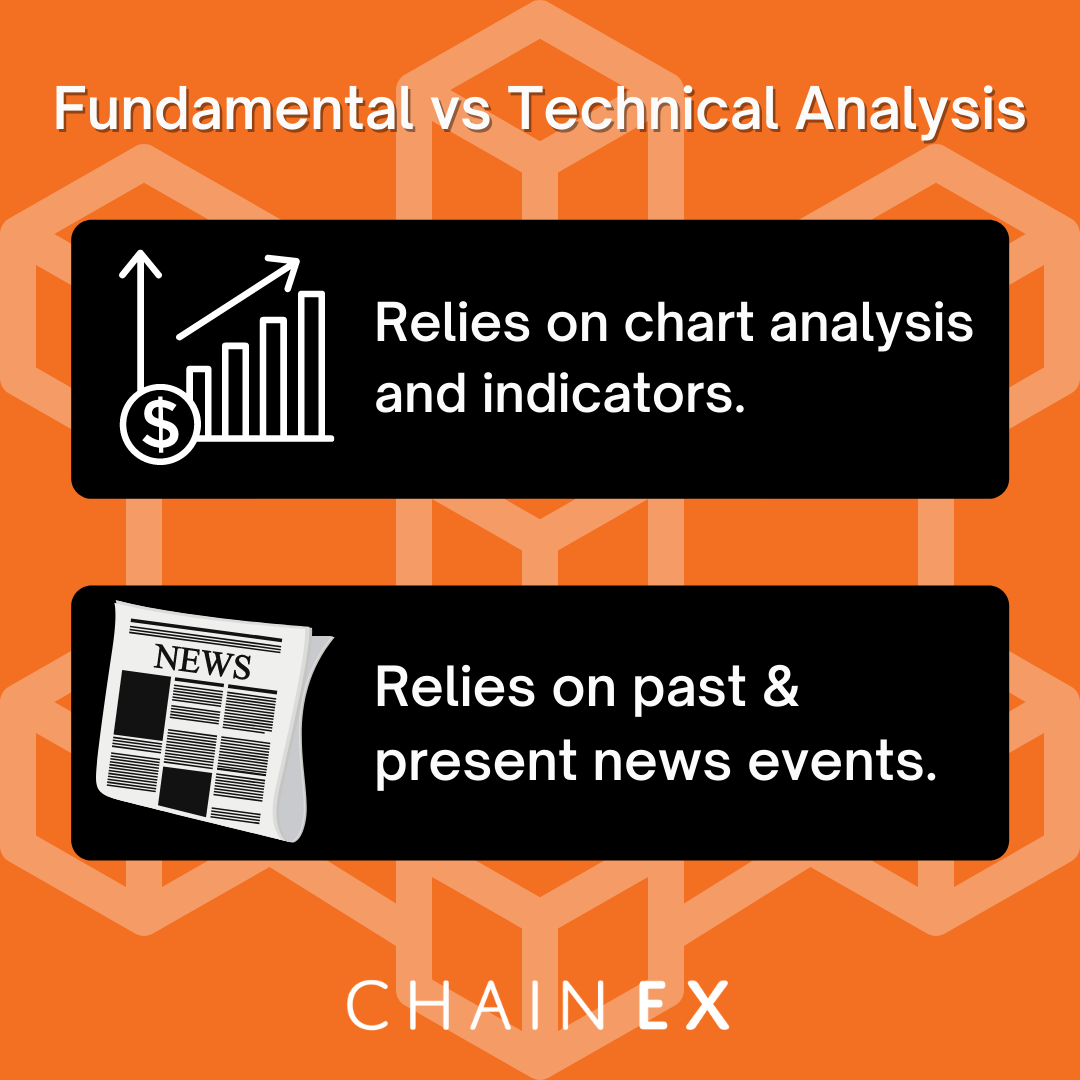
There are two primary types of chart and market analysis: fundamental and technical. Fundamental analysis looks at the specifics of an asset like Bitcoin or Ethereum. External factors such as the purpose of the coin, token economics, the team behind the currency and news play a very big role.
Technical analysis is mostly involved with pattern recognition, regardless of performance. These patterns are then used to uncover pricing trends. Fundamental analysis can help determine what to buy, while technical analysis can help determine when to buy. Well-rounded traders like you will apply both types of analysis, right?
The history of analysis
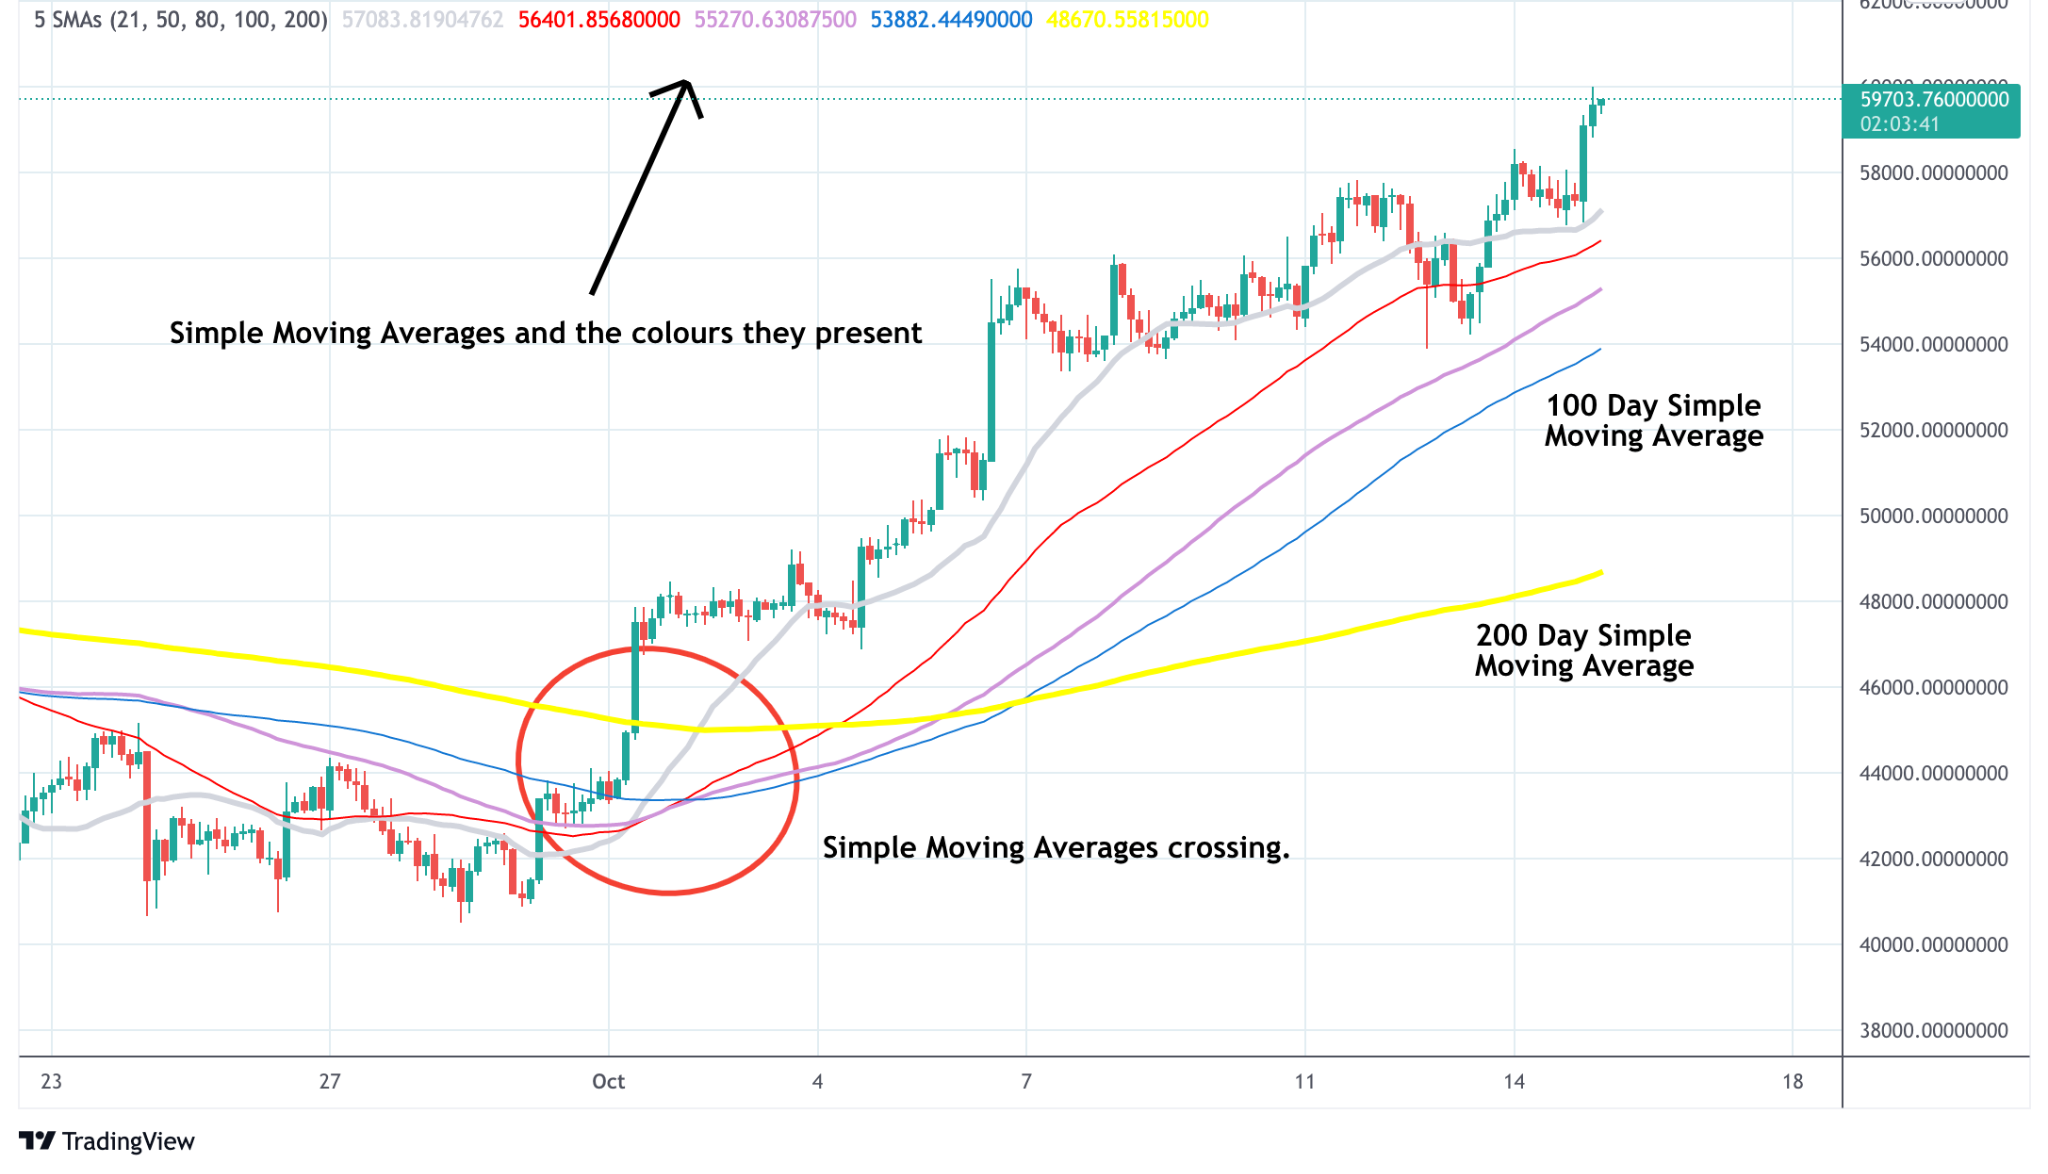
Back in the day, technical analysts relied on simple things such as drawing trendlines or following a simple Moving Average crossover strategy. Today, everyone interested in technical analysis has a huge variety of powerful tools at their disposal.
Multiple technical indicators, intra-market analysis, machine learning, and artificial intelligence are just a few examples of the tools and methods at your disposal. Nowadays, a trading strategy can rely on a simple combination of indicators to an advanced network to forecast price movements. The financial markets are a complex system so there is more than one way to achieve a given result.
Fundamental & Technical Analysis: The difference
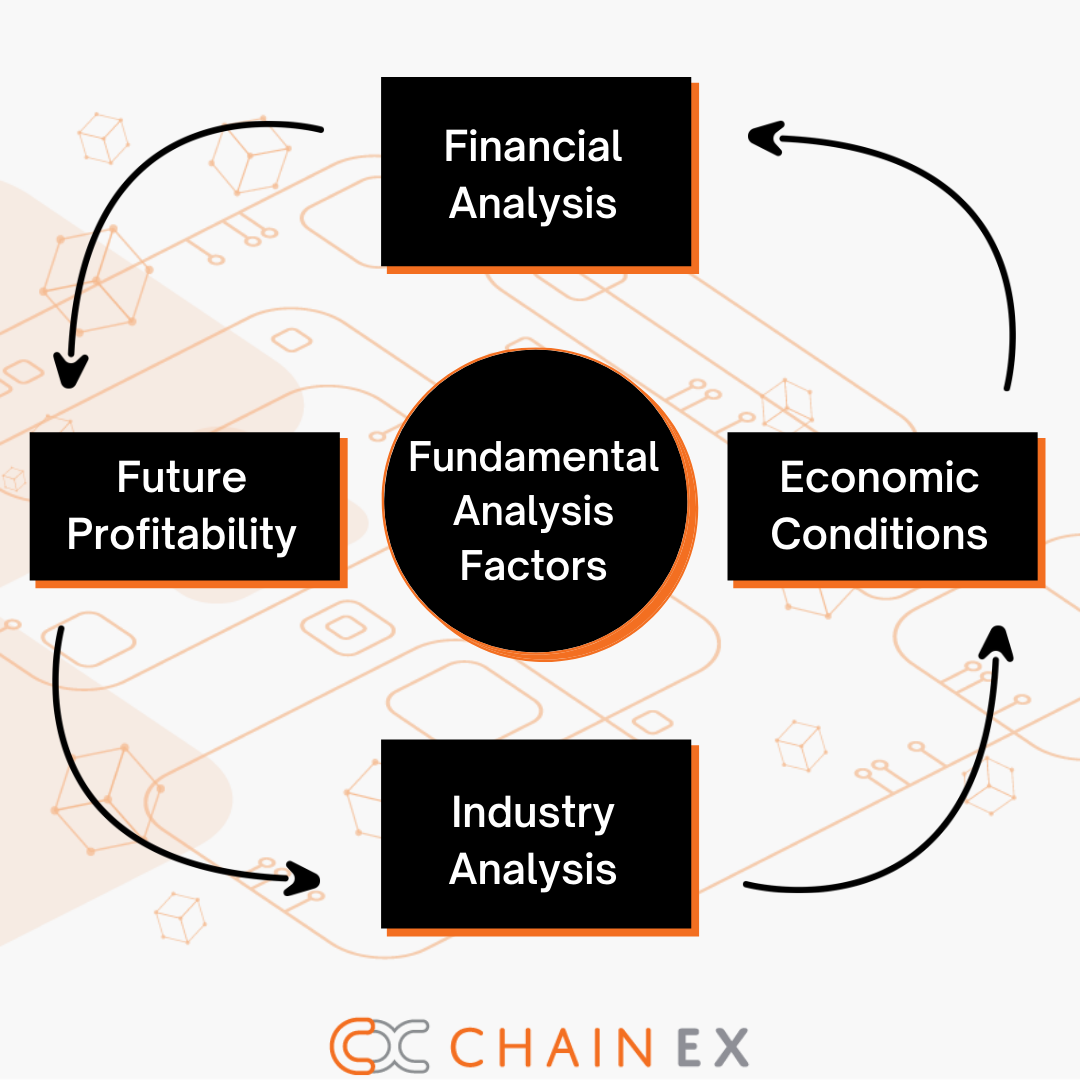
Fundamental Analysis refers to the detailed examination of the basic factors which influence the price and movement of the economy and the asset. It is meant to anticipate the future value of an asset by measuring the economic, financial and other factors to identify buying or selling opportunities.
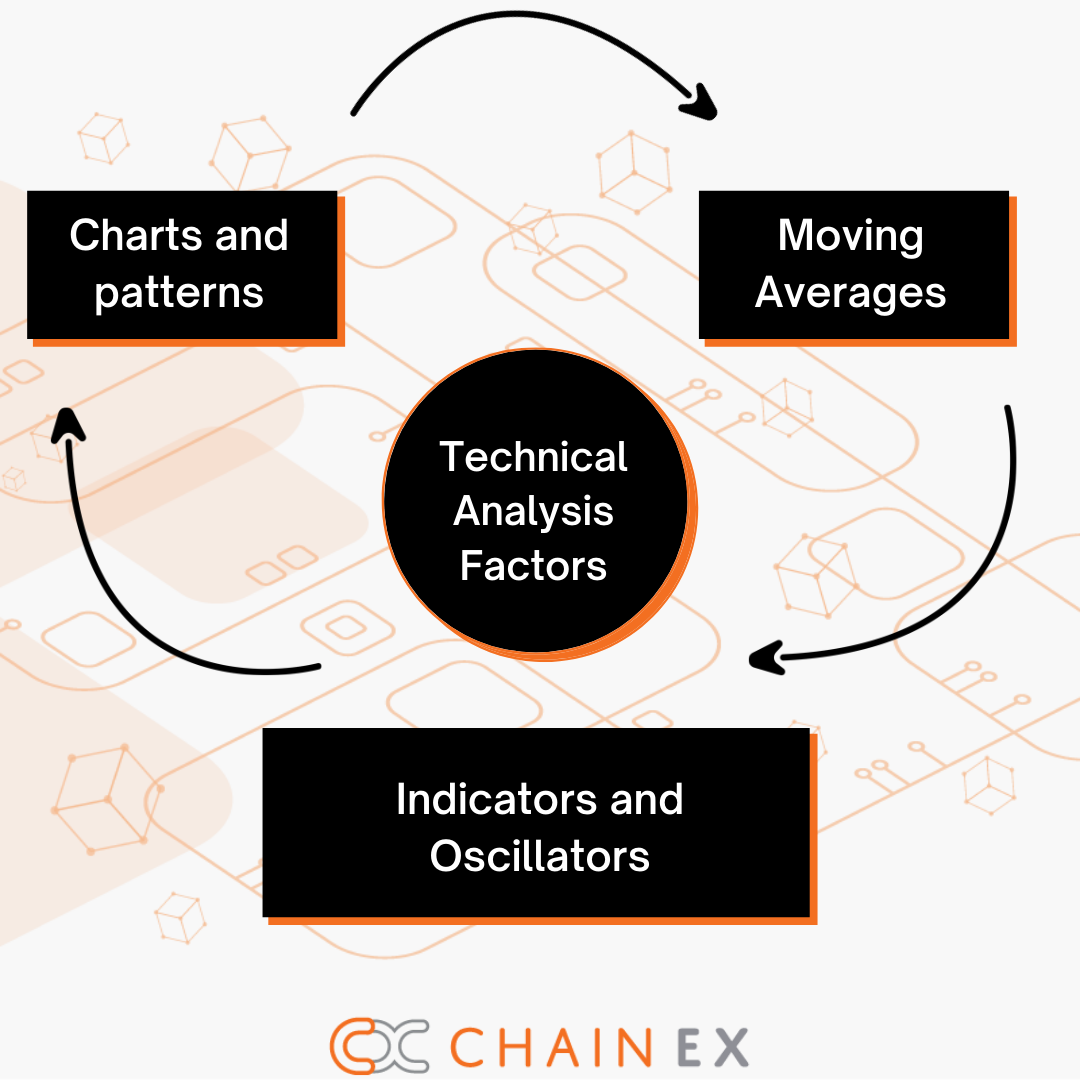
Technical Analysis is used to predict the price of your chosen asset. The concept is that the price of the asset is based on supply and demand, and the number of traders at the time in the marketplace. Based on past performance depending on which timeframe you analyse your charts, technical analysis assumes that prices will bounce off of support and resistance. Technical analysis gives you a clear and comprehensive view of the reason for changes in prices of a cryptocurrency.
Indicators: How they play a part
Simple moving averages are indicators that help assess the asset’s trend by averaging the daily price over a fixed time period. Buy and sell signals are generated when a shorter duration moving average crosses a longer duration one.
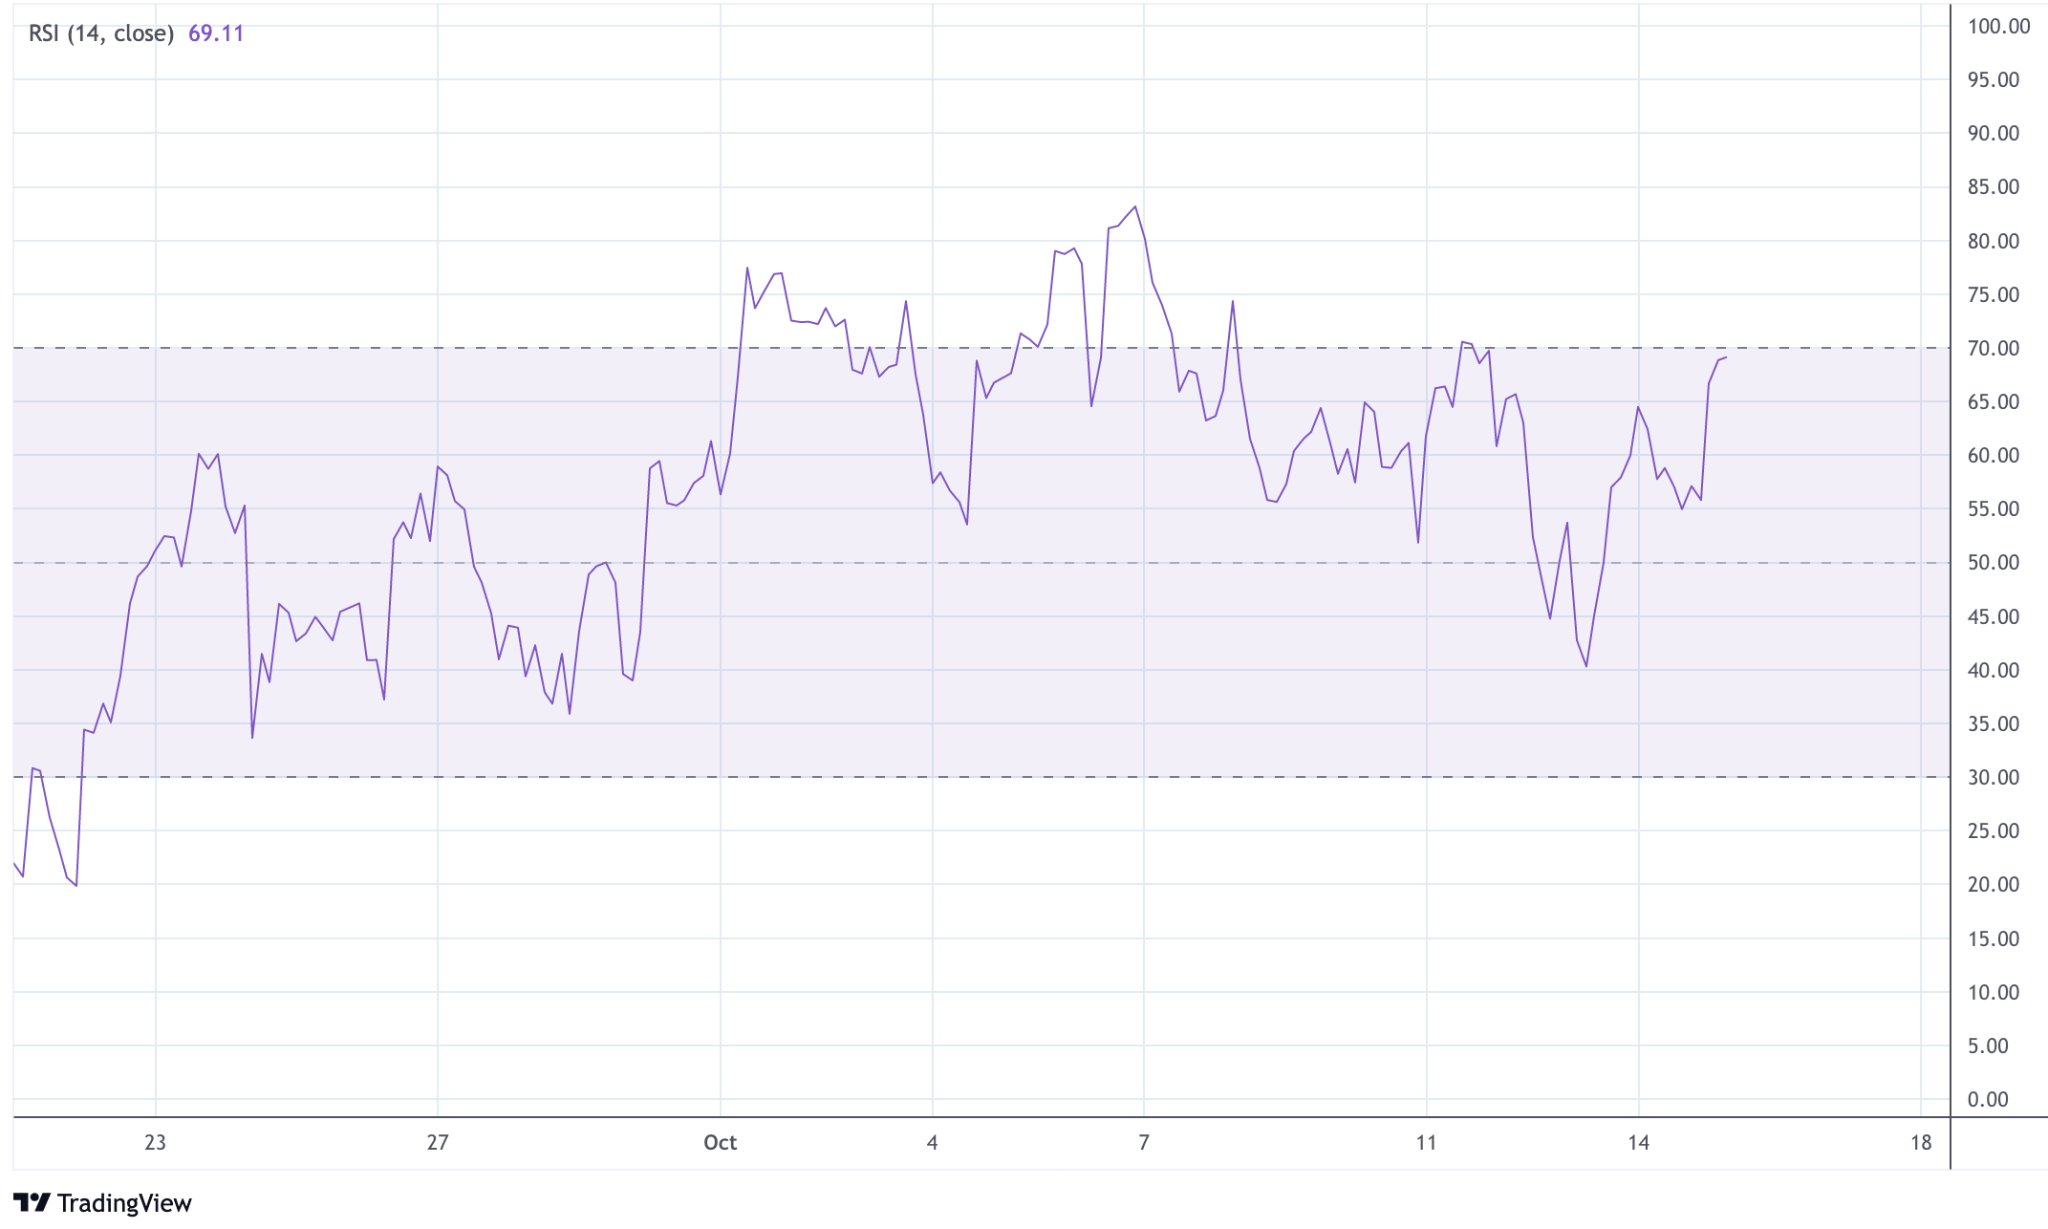
Relative strength index (RSI) is a momentum indicator that indicates overbought or oversold situations of a cryptocurrency. It’s one of the most common indicators used in technical analysis. More specifically, RSI is an oscillator, a separate category of technical analysis indicators from Moving Averages.
RSI calculates a band between 2 extreme values (0 to 100) to measure the impact or magnitude of price movements as well as the speed of these movements. Therefore, RSI thrives in choppy or oscillating trading markets or markets without strong trends, in contrast to moving averages.
Support and resistance utilize price history. Support is a price level where a downtrend can be expected to pause or bounce due to a concentration of demand or buying interest. As the price of assets drop, demand for that asset increases, thus forming the support line. Meanwhile, resistance zones arise due to selling interest when prices have increased.
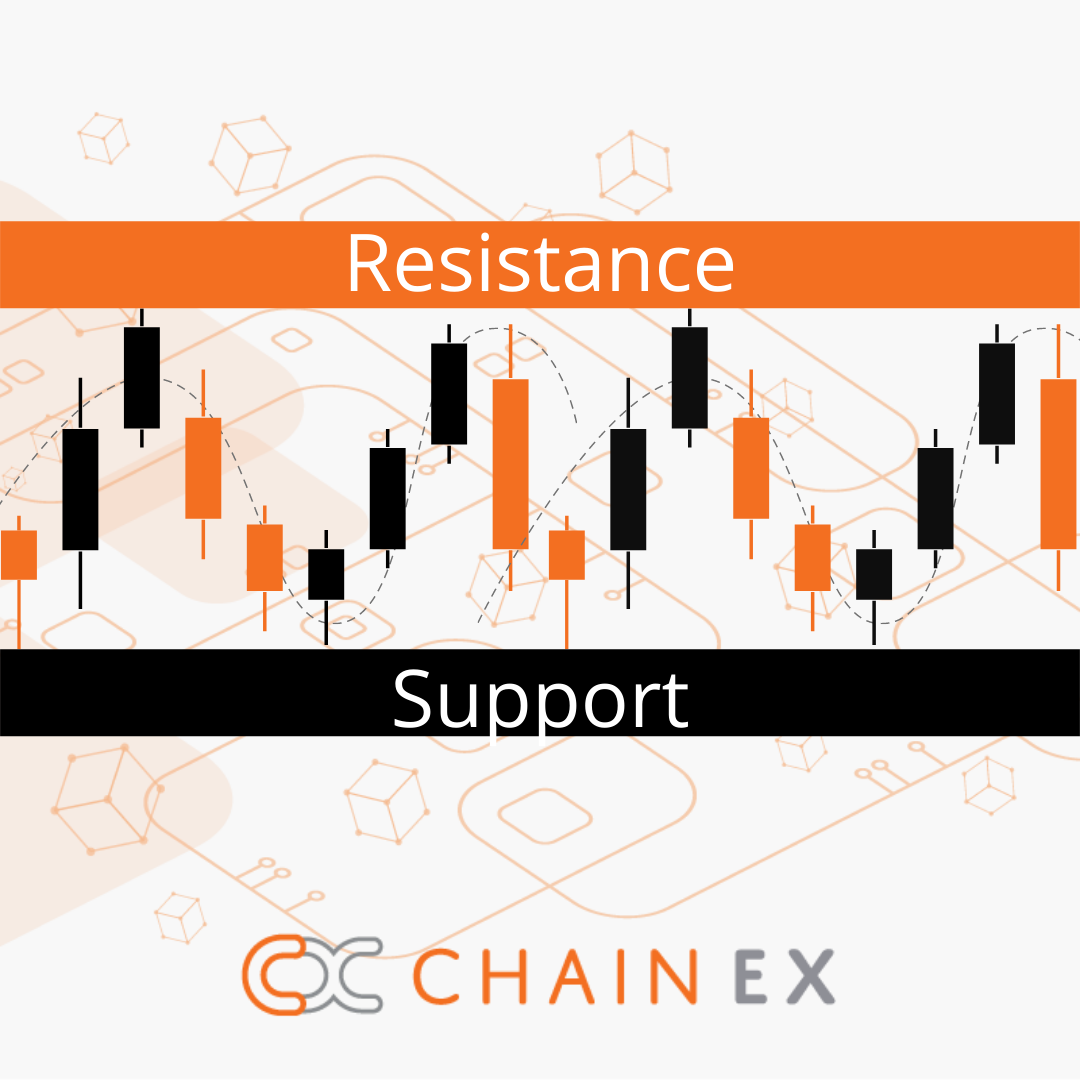
Once an area or zone of support or resistance has been identified, those price levels can serve as potential entry or exit points because, as a price reaches a point of support or resistance, it will do one of two things; bounce back away from the support or resistance level, or break past the price level and continue in its direction until it hits the next support or resistance level.
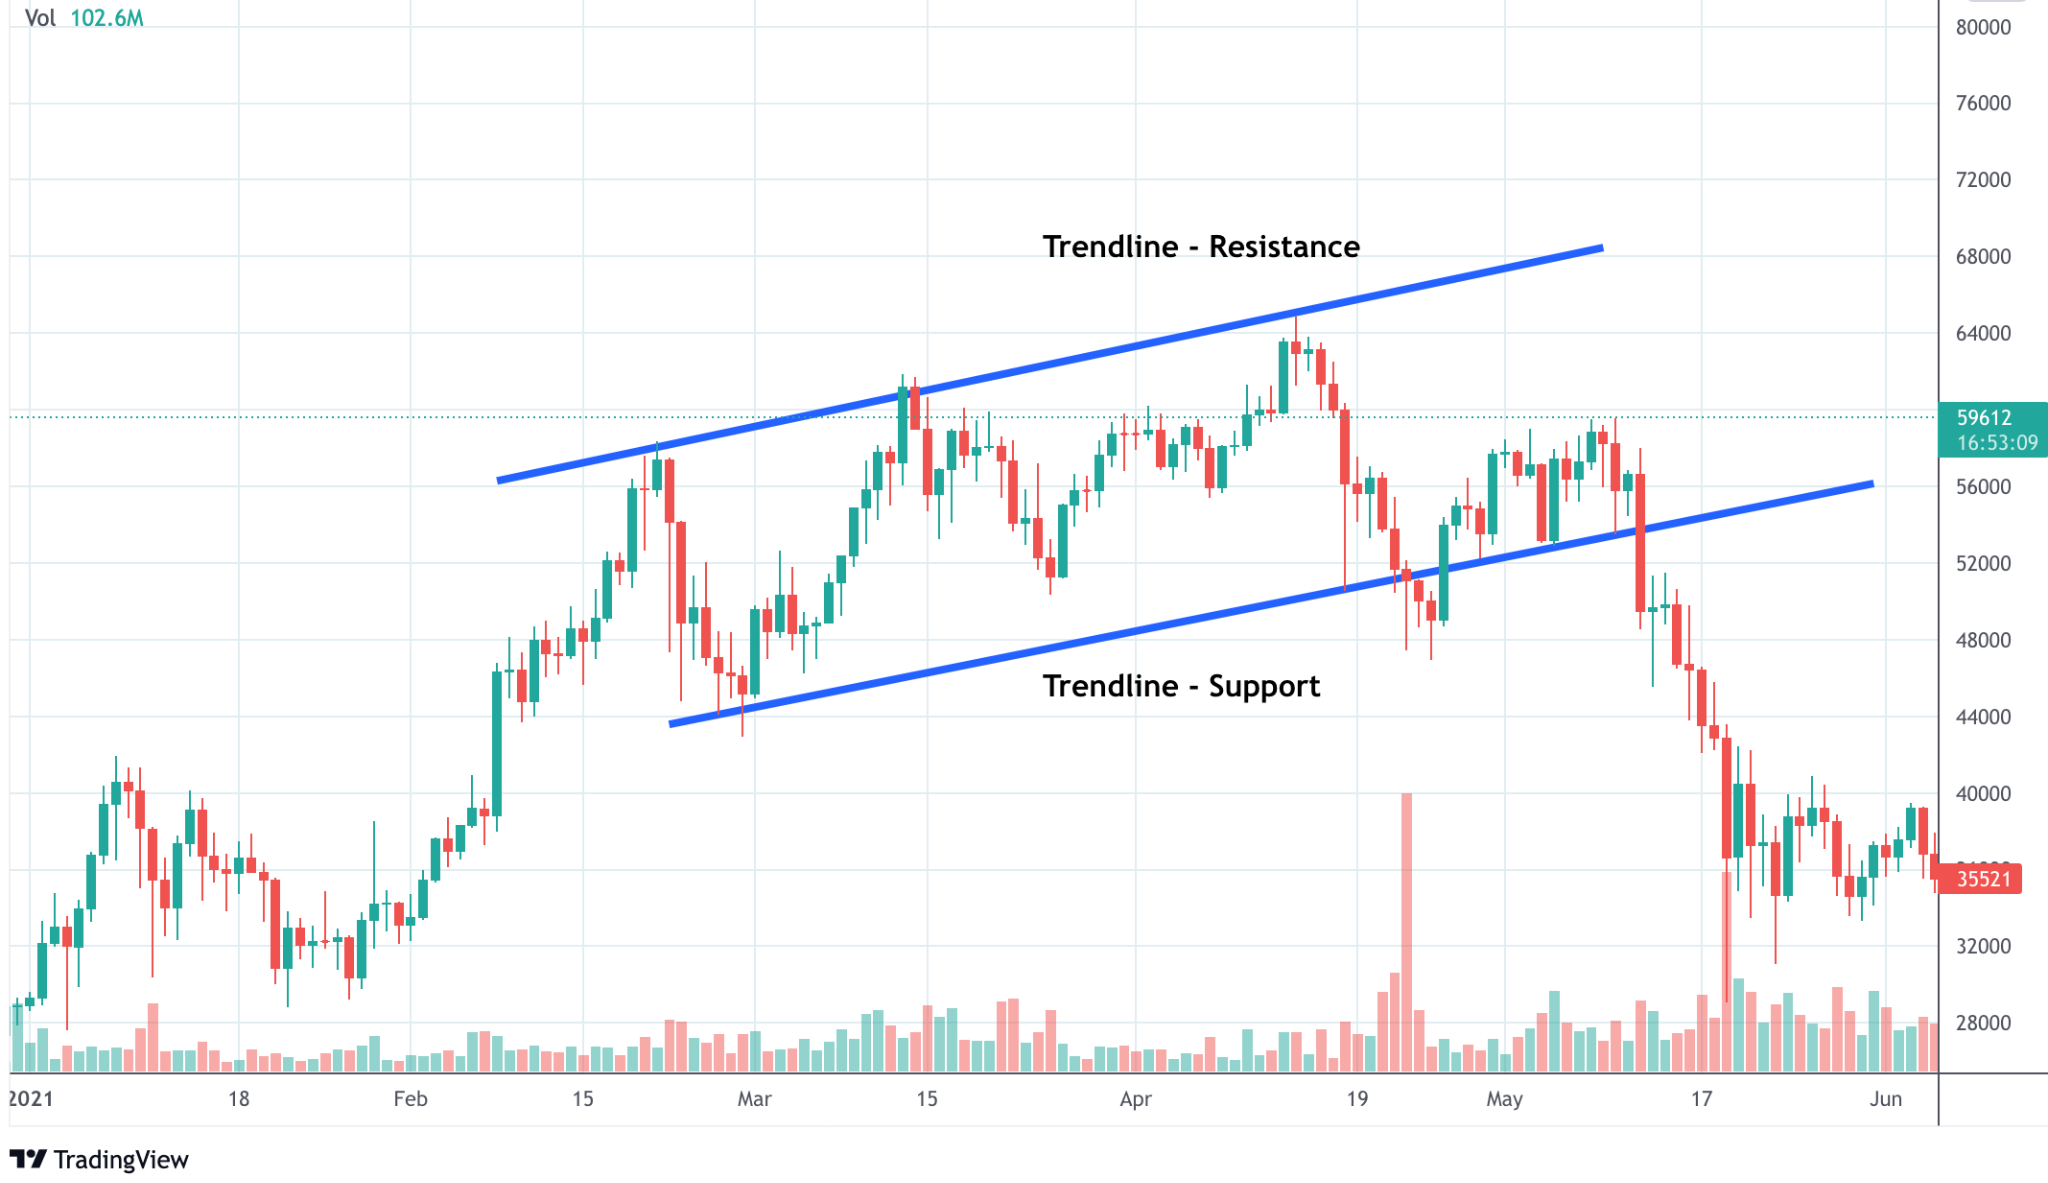
Trend lines are similar to support and resistance, as they provide defined entry and exit points. However, they differ in that they are projections based on how the asset has traded in the past. They are often utilized for assets moving to new highs or new lows where there is no price history.
There are a number of momentum-based indicators, such as Bollinger Bands, Chaikin Money Flow, stochastics, and moving average convergence/divergence (MACD). Each of these have unique formulas and provide buy and sell signals based on varying criteria. Momentum indicators tend to be used in range-bound or trendless markets.
You’ve learned the basics behind trading and analysis, so the next step is to apply what you’ve learnt - start trading! New users trade for free in October!
Zero fee October!
For the entire month of October, all newly registered users will have no fees whatsoever! As your preferred South African cryptocurrency exchange, we’d love to welcome you to ChainEX! And as such, for the full month of October you are entitled to pay no fees whatsoever on all your trades amounting to a total of 0.25 BTC in trading volume!
What are you waiting for?

Invite a friend to ChainEX and earn more free cryptocurrencies! Plus you’ll be partnering with what could potentially be the best cryptocurrency exchange in South Africa. I mean, EVERYONE is talking about ChainEX.
ChainEX is a South African cryptocurrency exchange that provides a platform for South Africans to buy, sell, or trade Bitcoin, Ethereum and a variety of other different cryptocurrencies using the South African rand as the default fiat-buying currency. And also the first South African crypto exchange to list Bitcoin Vault, YFI, SUSHI, LINK & UNI! The South African crypto market is growing by the day!

ChainEX provides you with a secure, online platform from which you can purchase and trade with different cryptocurrencies.
Get to know ChainEX
Download your app | Who is ChainEX? | FAQ’s | Sign Up | Follow Us |ChainEX Markets | ChainEX Security | |More friends, more crypto
Disclaimer:
There is no such thing as a 100% safe investment, and each decision has its risks. In any case, it is up to you to decide. All content and topics covered are mere opinions and do not constitute investment advice. Trading and investing in Bitcoin or any cryptocurrency carries a high level of risk. We do not assume any responsibility for actions taken upon reading any of our articles. ChainEX is not a financial advisory firm, investment manager, or financial consultant.